Monitor
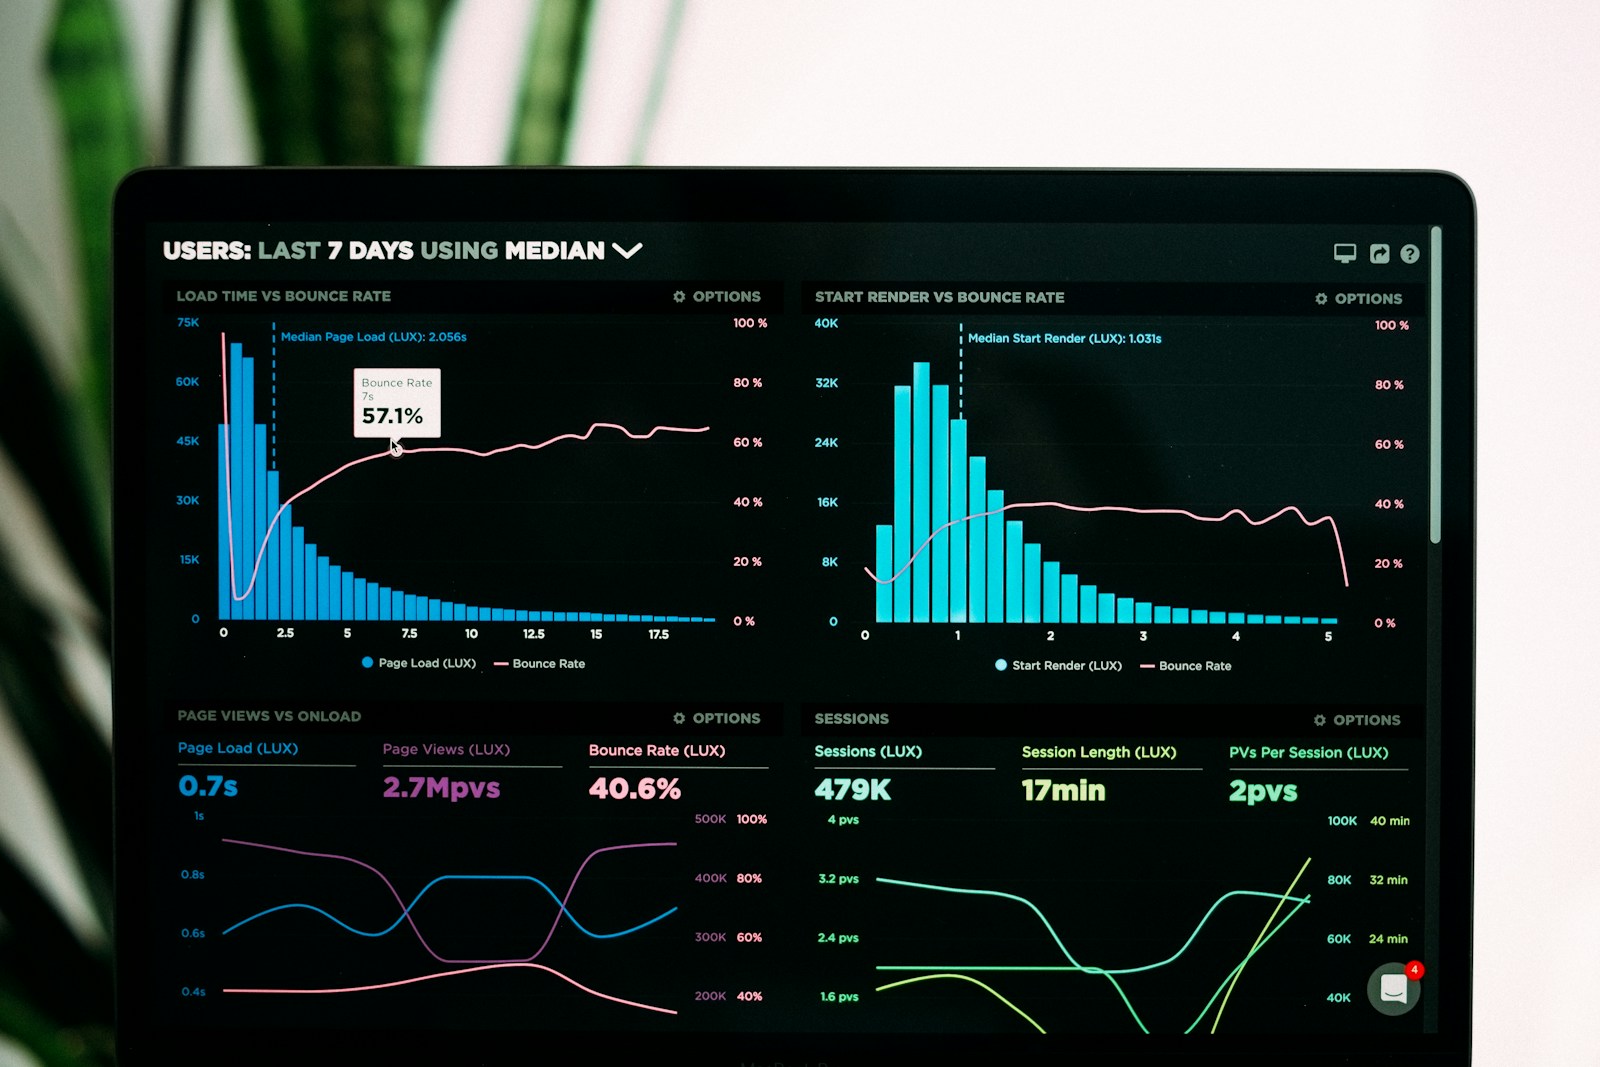
Real-time dashboards for latency, throughput, error rates, and resource utilisation across every model endpoint and batch job in your estate.
Signal-first infrastructure
NeuralScope is an AI observability platform built for production engineering teams. We unify monitoring, drift detection, distributed tracing, audit logging, alerting, and governance into a single operational surface — so your models stay reliable under real-world load.
Signal Manifesto
When a traditional web service degrades, logs and metrics usually tell you why. When a machine learning model degrades, the failure modes are subtler: silent drift in feature distributions, latency spikes on specific input clusters, hallucination rates that climb without triggering conventional alerts. NeuralScope exists because AI systems deserve the same rigour we apply to databases, APIs, and payment rails.
Our platform philosophy centres on three commitments. First, every signal that matters to model health should be visible in one place — not scattered across notebooks, vendor dashboards, and ad-hoc scripts. Second, detection must be proactive: waiting for user complaints is not a monitoring strategy. Third, governance must be operational, not ceremonial — audit trails, access controls, and policy enforcement should integrate with the same toolchain your SREs already use.
We work with platform engineers, ML engineers, and reliability teams at organisations shipping inference at scale. Whether you run batch scoring pipelines, real-time recommendation engines, or multi-model agent orchestration, NeuralScope gives you a coherent picture of what your models are doing right now — and what they were doing when something went wrong.
Based in Toronto, we build for Canadian privacy expectations and global operational standards. Our studio on Richmond Street West is where we run architecture reviews, telemetry integration workshops, and hands-on observability lab sessions with client teams. This is engineering infrastructure, not marketing theatre.
Six Observability Domains
Real-time dashboards for latency, throughput, error rates, and resource utilisation across every model endpoint and batch job in your estate.
Automated drift detection on input features, output distributions, and embedding spaces — with configurable thresholds and seasonality awareness.
Distributed tracing across preprocessing, inference, postprocessing, and downstream API calls so you can follow a single prediction end to end.
Immutable audit logs for model versions, deployment events, configuration changes, and human-in-the-loop decisions with PIPEDA-aligned retention policies.
Intelligent alerting with deduplication, escalation paths, and integration to PagerDuty, Slack, and your existing incident management workflows.
Policy enforcement for model access, data lineage tracking, and compliance reporting — designed for teams accountable to regulators and internal risk committees.
Architecture Scope Panel
Before a single collector ships, NeuralScope runs an architecture scope review with your team. We document every model endpoint, data source, feature store connection, and downstream consumer. The result is a living topology map that becomes the foundation for your observability rollout.
Our Richmond Street studio hosts these sessions in person or via secure video. Teams leave with a prioritised instrumentation plan, identified blind spots, and clear ownership for each observability domain. No generic templates — every scope panel is tailored to your stack, whether you run on Kubernetes, serverless, or bare-metal GPU clusters.
Deliverable: Architecture scope document with instrumentation roadmap and risk register.
Programme Preview
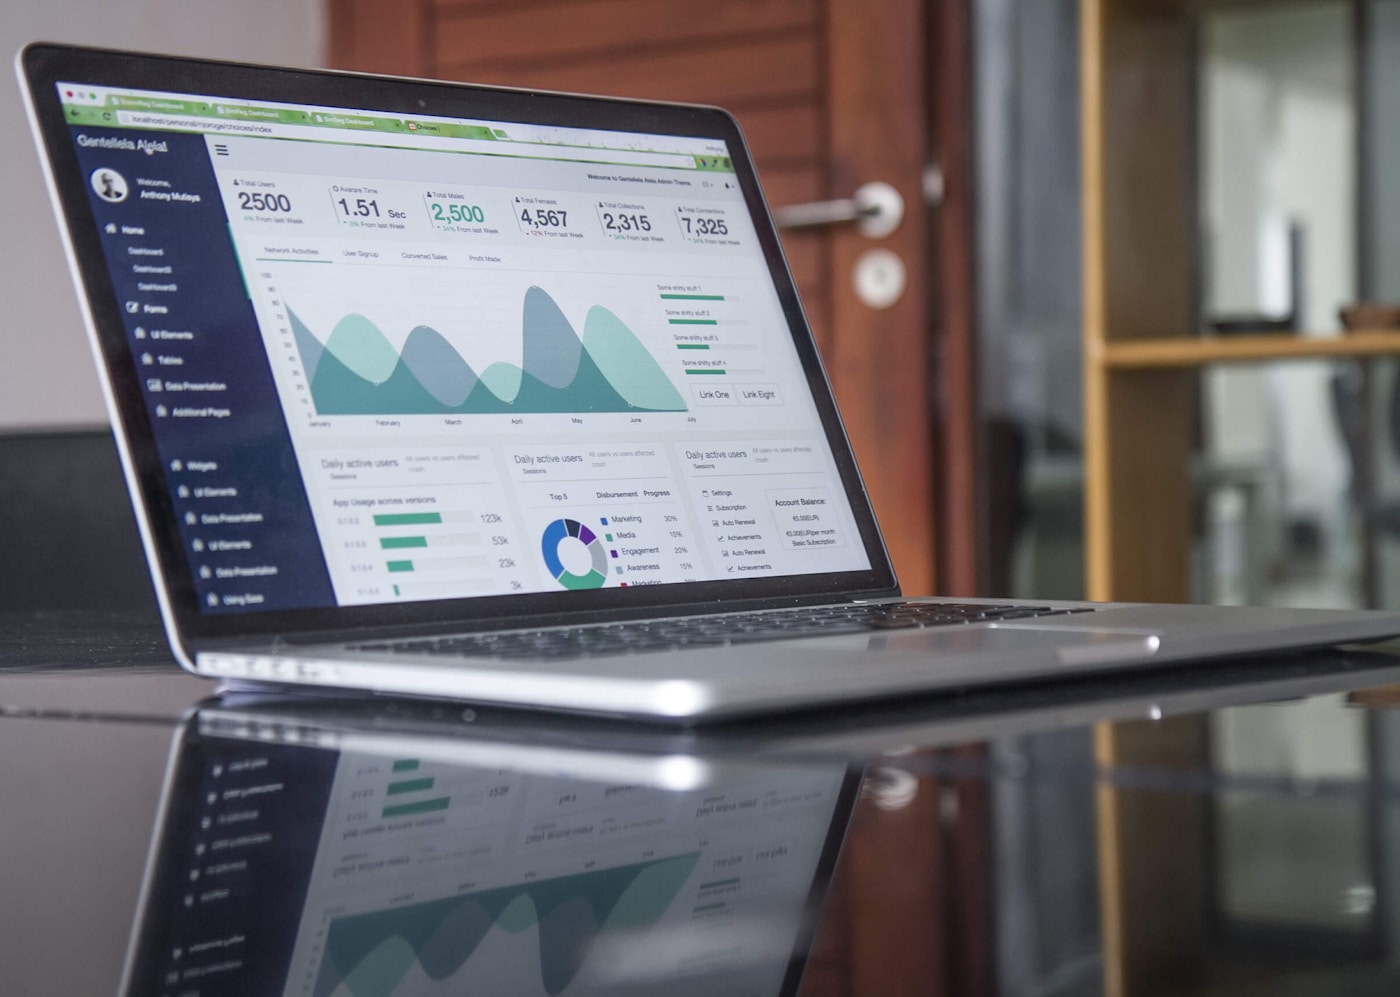
Instrument your first model endpoint with baseline metrics, structured logging, and health checks. Ideal for teams beginning their observability journey.
C$2,400 · 2-day intensive
View all programmes
Deploy automated drift detectors, configure alert thresholds, and build runbooks for model degradation incidents.
C$4,800 · 3-day workshop
Common Questions
No. NeuralScope is an AI observability platform and engineering consultancy. We build monitoring infrastructure, drift detection pipelines, and governance tooling for production ML systems. We do not provide advertising, brand strategy, or creative campaign services.
We support OpenTelemetry, Prometheus, Grafana, Datadog, MLflow, Weights & Biases, Kubeflow, SageMaker, Vertex AI, and custom gRPC/REST inference servers. Our collectors are designed to fit into existing SRE workflows.
Yes. Our primary data residency is Canadian. We offer region-specific collector deployments for organisations with data sovereignty requirements under PIPEDA and provincial privacy legislation.
A focused pilot covering one model family usually takes four to six weeks from scope panel to production dashboards. Enterprise-wide rollouts are phased over quarters depending on estate complexity.
No responsible observability vendor can guarantee zero drift — models operate in changing environments by definition. What we guarantee is early detection, clear alerting, and actionable runbooks so your team can respond before drift impacts business outcomes.
We work with teams from Series A startups shipping their first production model through to regulated enterprises with hundreds of endpoints. Programme modules scale to your current maturity level.
A 45-minute walkthrough of the NeuralScope platform using anonymised sample data, plus a discussion of your current observability gaps. No sales pressure — we focus on technical fit.
Our headquarters and studio are at 296 Richmond Street West, Suite 402, Toronto, ON M5V 1X2. We serve clients across Canada and internationally.
Book a scope demo with our platform team. We will map your observability gaps and show you what production-grade AI monitoring looks like.
Request a scope demo